9. Databricks deployment
We deployed the tuned XGBoost in Databricks and created a dashboard for identifying suspicious activity and monitoring model performance.
The dashboard has three sheets:
- The Most Suspicious Transactions, Cards, and Terminals
- Monitoring Model Performance
- Transaction Activity Over Time
9.1 Training the model in Databricks and making predictions
We took the tuned hyperparameters from our Python run and used Pyspark and MLFlow to train the model in Databricks on the Handbook’s training dataset. We registered the model in Databricks then generated predictions on subsequent transactions, storing them in a delta table in the Unity Catalog.
Click to expand/hide Databricks Python/Pyspark/MLFlow code
 ```python
%pip install xgboost==1.7.5
%pip install threadpoolctl==3.1.0
dbutils.library.restartPython()

""" 1. Read the transactions from the Parquet file uploaded to Databricks """

transactions_df = spark.read.parquet("/Volumes/workspace/default/fraud_volume/fraud_data_full_fixed.parquet")
from pyspark.sql.functions import col

# List all columns that are integer and can have missing values
int_cols = [
    'TRANSACTION_ID', 'CUSTOMER_ID', 'TERMINAL_ID', 'TX_TIME_SECONDS',
    'TX_TIME_DAYS', 'TX_FRAUD', 'TX_FRAUD_SCENARIO',
    'TX_DURING_WEEKEND', 'TX_DURING_NIGHT'
    # Add others as needed from your schema
]

# Cast integer columns to float (double in Spark)
for c in int_cols:
    transactions_df = transactions_df.withColumn(c, col(c).cast('double'))

from pyspark.sql.functions import col, lit
import datetime

# Convert string dates to Python datetime
start_date = datetime.datetime.strptime("2018-07-04", "%Y-%m-%d")
end_date = datetime.datetime.strptime("2018-08-15", "%Y-%m-%d")

# Adjust end_date to include the entire day (inclusive)
adjusted_end_date = end_date + datetime.timedelta(days=1) - datetime.timedelta(microseconds=1)

# Filter transactions_df for date range
transactions_df = transactions_df.filter(
    (col('TX_DATETIME') >= lit(start_date))
    # & (col('TX_DATETIME') <= lit(adjusted_end_date))
)

# Features and target
output_feature = "TX_FRAUD"
input_features = ['TX_AMOUNT','TX_DURING_WEEKEND', 'TX_DURING_NIGHT', 'CUSTOMER_ID_NB_TX_1DAY_WINDOW',
           'CUSTOMER_ID_AVG_AMOUNT_1DAY_WINDOW', 'CUSTOMER_ID_NB_TX_7DAY_WINDOW',
           'CUSTOMER_ID_AVG_AMOUNT_7DAY_WINDOW', 'CUSTOMER_ID_NB_TX_30DAY_WINDOW',
           'CUSTOMER_ID_AVG_AMOUNT_30DAY_WINDOW', 'TERMINAL_ID_NB_TX_1DAY_WINDOW',
           'TERMINAL_ID_RISK_1DAY_WINDOW', 'TERMINAL_ID_NB_TX_7DAY_WINDOW',
           'TERMINAL_ID_RISK_7DAY_WINDOW', 'TERMINAL_ID_NB_TX_30DAY_WINDOW',
           'TERMINAL_ID_RISK_30DAY_WINDOW']

# Rename columns - create a map of old to new column names
rename_map = {}
for window in [1,7,30]:
    rename_map[f'CUSTOMER_ID_NB_TX_{window}DAY_WINDOW'] = f'Cust_Nb_Tx_{window}Day'
    rename_map[f'CUSTOMER_ID_AVG_AMOUNT_{window}DAY_WINDOW'] = f'Cust_Avg_Amt_{window}Day'
    rename_map[f'TERMINAL_ID_NB_TX_{window}DAY_WINDOW'] = f'Term_Nb_Tx_{window}Day'
    rename_map[f'TERMINAL_ID_RISK_{window}DAY_WINDOW'] = f'Term_Risk_{window}Day'

# Apply renaming to DataFrame
for old_col, new_col in rename_map.items():
    transactions_df = transactions_df.withColumnRenamed(old_col, new_col)

# Update input_features list to new names where applicable
input_features = [rename_map.get(feat, feat) for feat in input_features]

# Define training and testing periods
start_date_training = datetime.datetime.strptime("2018-07-25", "%Y-%m-%d")
delta_train = delta_delay = delta_test = 7
end_date_training = start_date_training + datetime.timedelta(days=delta_train-1)
start_date_test = start_date_training + datetime.timedelta(days=delta_train + delta_delay)
end_date_test = start_date_training + datetime.timedelta(days=delta_train + delta_delay + delta_test - 1)

def get_train_test_set(transactions_df,
                       start_date_training,
                       delta_train=7,
                       delta_delay=7,
                       delta_test=7):
    from pyspark.sql import Window
    from pyspark.sql.functions import min as spark_min

    # Filter for training data
    train_df = transactions_df.filter(
        (col("TX_DATETIME") >= lit(start_date_training)) &
        (col("TX_DATETIME") < lit(start_date_training + datetime.timedelta(days=delta_train)))
    )

    # Collect known defrauded customers from training set as a Python set
    known_defrauded_customers = set(row['CUSTOMER_ID'] for row in train_df.filter(col('TX_FRAUD') == 1).select('CUSTOMER_ID').distinct().collect())

    # Get minimum TX_TIME_DAYS in training set
    start_tx_time_days_training = train_df.select(spark_min("TX_TIME_DAYS")).collect()[0][0]

    test_df_list = []

    # For each test day
    for day in range(delta_test):
        day_val = start_tx_time_days_training + delta_train + delta_delay + day
        test_df_day = transactions_df.filter(col('TX_TIME_DAYS') == day_val)

        # Defrauded customers known at test day-delay period
        delay_period_val = start_tx_time_days_training + delta_train + day - 1
        test_df_day_delay_period = transactions_df.filter(col('TX_TIME_DAYS') == delay_period_val)

        new_defrauded_customers = set(row['CUSTOMER_ID'] for row in test_df_day_delay_period.filter(col('TX_FRAUD') ==1).select('CUSTOMER_ID').distinct().collect())

        # Update known defrauded
        known_defrauded_customers = known_defrauded_customers.union(new_defrauded_customers)

        # Exclude known defrauded customers from test day
        test_df_day = test_df_day.filter(~col('CUSTOMER_ID').isin(known_defrauded_customers))

        test_df_list.append(test_df_day)

    # Union all test days to a single DataFrame
    from functools import reduce
    test_df = reduce(lambda df1, df2: df1.union(df2), test_df_list)

    # Order by TRANSACTION_ID
    train_df = train_df.orderBy('TRANSACTION_ID')
    test_df = test_df.orderBy('TRANSACTION_ID')

    return train_df, test_df

train_df, test_df = get_train_test_set(transactions_df, start_date_training,
                                      delta_train=7, delta_delay=7, delta_test=7)


""" 3. Train and register the model """

import mlflow
import mlflow.sklearn
from sklearn.pipeline import Pipeline
from xgboost import XGBClassifier
from mlflow.tracking import MlflowClient
from mlflow.models.signature import infer_signature

# Enable MLflow autologging for XGBoost
mlflow.xgboost.autolog()

# Prepare your data (convert Spark DataFrame to Pandas)
train_pd = train_df.select(input_features + [output_feature]).toPandas()
X_train = train_pd[input_features]
y_train = train_pd[output_feature]

# Define pipeline with your XGBClassifier hyperparameters
pipeline = Pipeline(steps=[
    ('clf', XGBClassifier(
        learning_rate=0.1730096673483238,
        max_depth=4,
        n_estimators=69,
        random_state=0,
        eval_metric='logloss'
    ))
])

with mlflow.start_run(run_name="pipeline_train_free_edition"):
    pipeline.fit(X_train, y_train)

    # Prepare an example input (take a few rows from training data)
    input_example = X_train.head(3)

    # Infer model signature automatically
    signature = infer_signature(X_train, pipeline.predict(X_train))

    # Log model with input example and signature, register in Unity Catalog
    mlflow.sklearn.log_model(
        sk_model=pipeline,
        artifact_path="pipeline_model",
        input_example=input_example,
        signature=signature,
        registered_model_name="default.fraud_detection_pipeline_model"
    )

""" 4. Predict P(fraud) for subsequent transactions """

# Fit predictions to a delta table from 8/8/18 thru 9/30/18.
from pyspark.sql.functions import date_format, col

fraud_volume_path = "/Volumes/workspace/default/fraud_volume/"

transactions_df = transactions_df.withColumn(
    "formatted_datetime",
    date_format(col("TX_DATETIME"), "MM/dd/yy HH:mm")
)

transactions_df = transactions_df.withColumn(
    "formatted_date",
    date_format(col("TX_DATETIME"), "MM/dd/yy")
)

transactions_pd = transactions_df.toPandas()
transactions_pd["prediction"] = pipeline.predict(transactions_pd[input_features])
transactions_pd["prediction_probability"] = pipeline.predict_proba(transactions_pd[input_features])[:, 1]

columns_to_save = [
    "TRANSACTION_ID", "CUSTOMER_ID", "TERMINAL_ID",
    "TX_DATETIME", "TX_FRAUD", "TX_FRAUD_SCENARIO", 'TX_AMOUNT',
    "prediction", "prediction_probability", "formatted_datetime", "formatted_date"
]
transactions_pd_subset = transactions_pd[columns_to_save]
preds_spark_df = spark.createDataFrame(transactions_pd_subset)

#Register as a delta table
preds_spark_df.write.format("delta").option("mergeSchema", "true").mode("overwrite").save(fraud_volume_path+"db_predictions_delta_table")

preds_spark_df.write.format("delta").option("mergeSchema", "true").mode("overwrite").saveAsTable("db_predictions_delta_table")

```
We then ran SQL queries to create the create datasets for the visualizations from the delta table.
Click to expand/hide SQL code for the predictions delta table
```sql
SELECT *,
CASE TX_FRAUD_SCENARIO
WHEN 0 THEN 'not fraud'
WHEN 1 THEN 'fraud w amount over $220'
WHEN 2 THEN 'fraud from avcompromised terminal'
WHEN 3 THEN 'fraud from a compromised card'
ELSE 'unknown'
END AS fraud_scenario
FROM delta.`/Volumes/workspace/default/fraud_volume/db_predictions_delta_table`
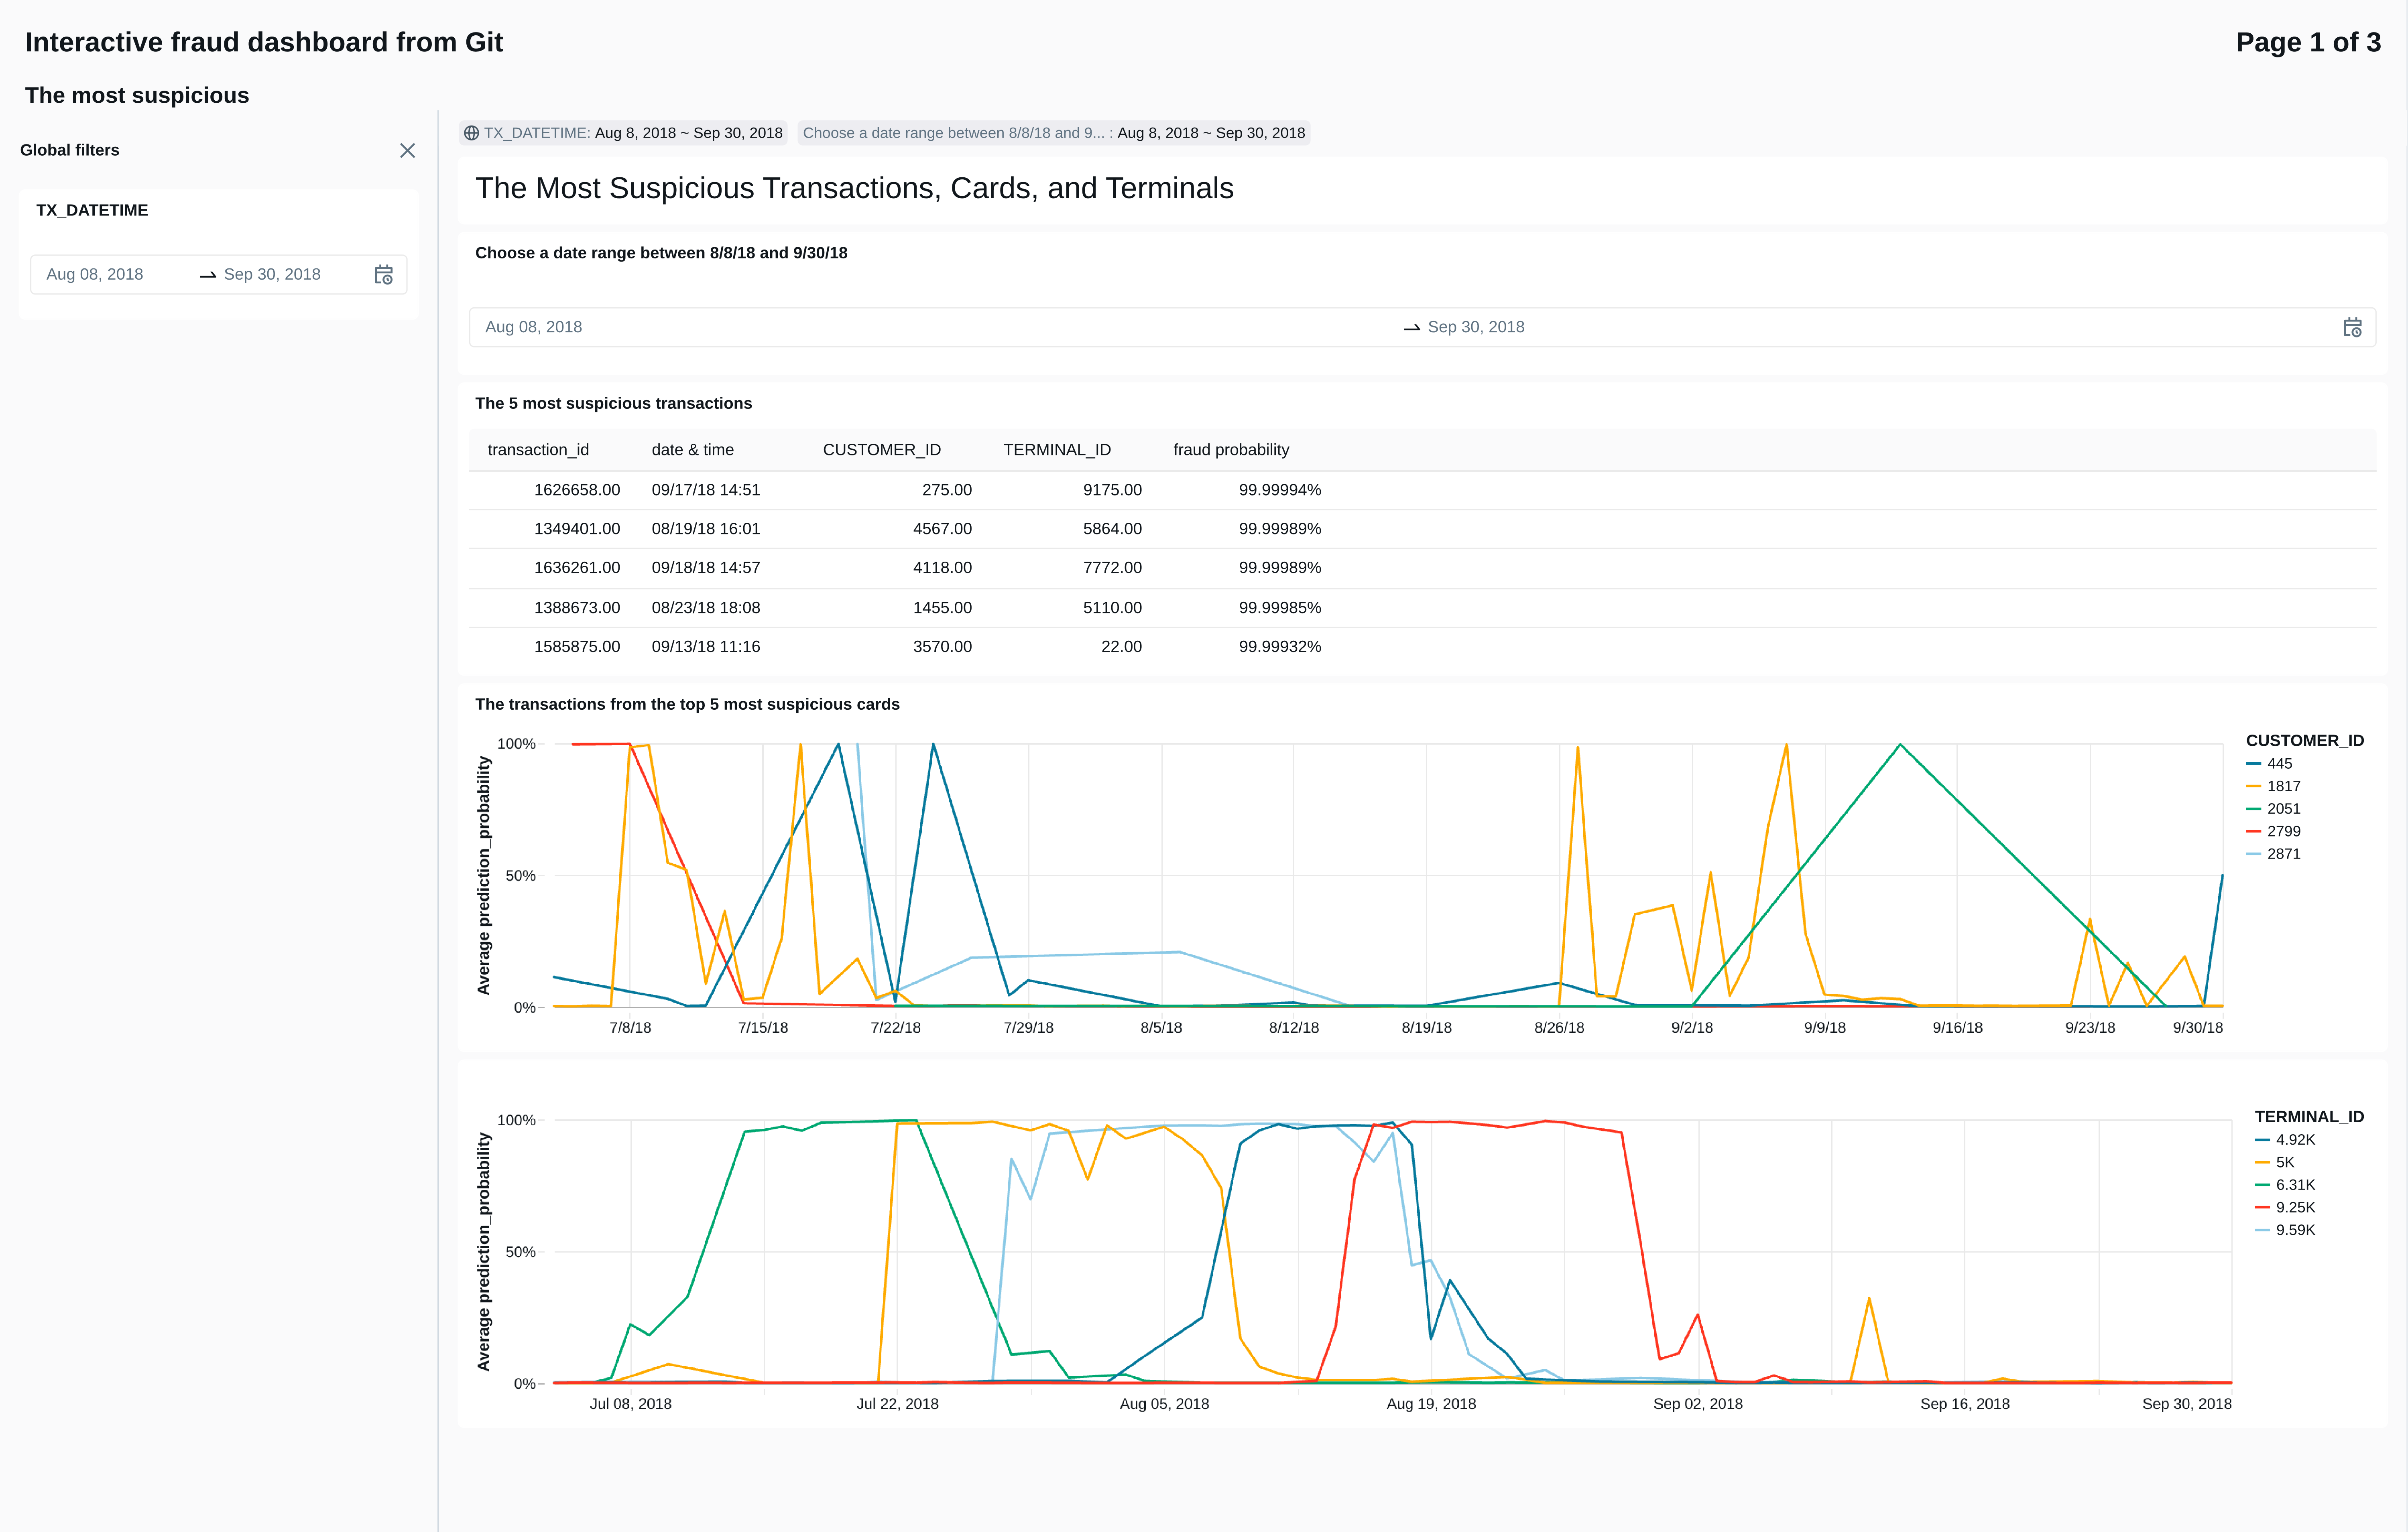
``` 9.2 The dashboard page showing suspicious activity
We used similar SQL queries to generate the visualizations monitoring the most suspicious transactions, cards, and point-of-sale terminals.
Click to expand/hide SQL code for the 5 most suspicious transactions
 ```sql
SELECT
  transaction_id, CUSTOMER_ID, TERMINAL_ID,
  formatted_datetime,
  prediction_probability
FROM default.db_predictions_delta_table
ORDER BY prediction_probability DESC
LIMIT 5;


```
Click to expand/hide SQL code for all transactions from the 5 most suspicious cards
 ```sql

-- All txs from the top 5 cards by average fraud probability
WITH top5_cards AS (
  SELECT
    CUSTOMER_ID AS card_id,
    AVG(prediction_probability) AS fraud_prob
  FROM default.db_predictions_delta_table
  GROUP BY CUSTOMER_ID
  ORDER BY AVG(prediction_probability) DESC
  LIMIT 5
)
SELECT
  *
FROM default.db_predictions_delta_table
WHERE CUSTOMER_ID IN (SELECT card_id FROM top5_cards);


```
Click to expand/hide SQL code for all transactions from the 5 most suspicious terminals
 ```sql
-- All txs from the top 5 terminals by average fraud probability
WITH top5_terminals AS (
  SELECT
    TERMINAL_ID,
    AVG(prediction_probability) AS fraud_prob
  FROM default.db_predictions_delta_table
  GROUP BY TERMINAL_ID
  ORDER BY AVG(prediction_probability) DESC
  LIMIT 5
)
SELECT
  *
FROM default.db_predictions_delta_table
WHERE TERMINAL_ID IN (SELECT TERMINAL_ID FROM top5_terminals);
```
The result is an interactive dashboard where the user can select a date range and see all suspicious activity from that range. Due to the limitations of Databricks Free Edition, I can only provide static images of the page.
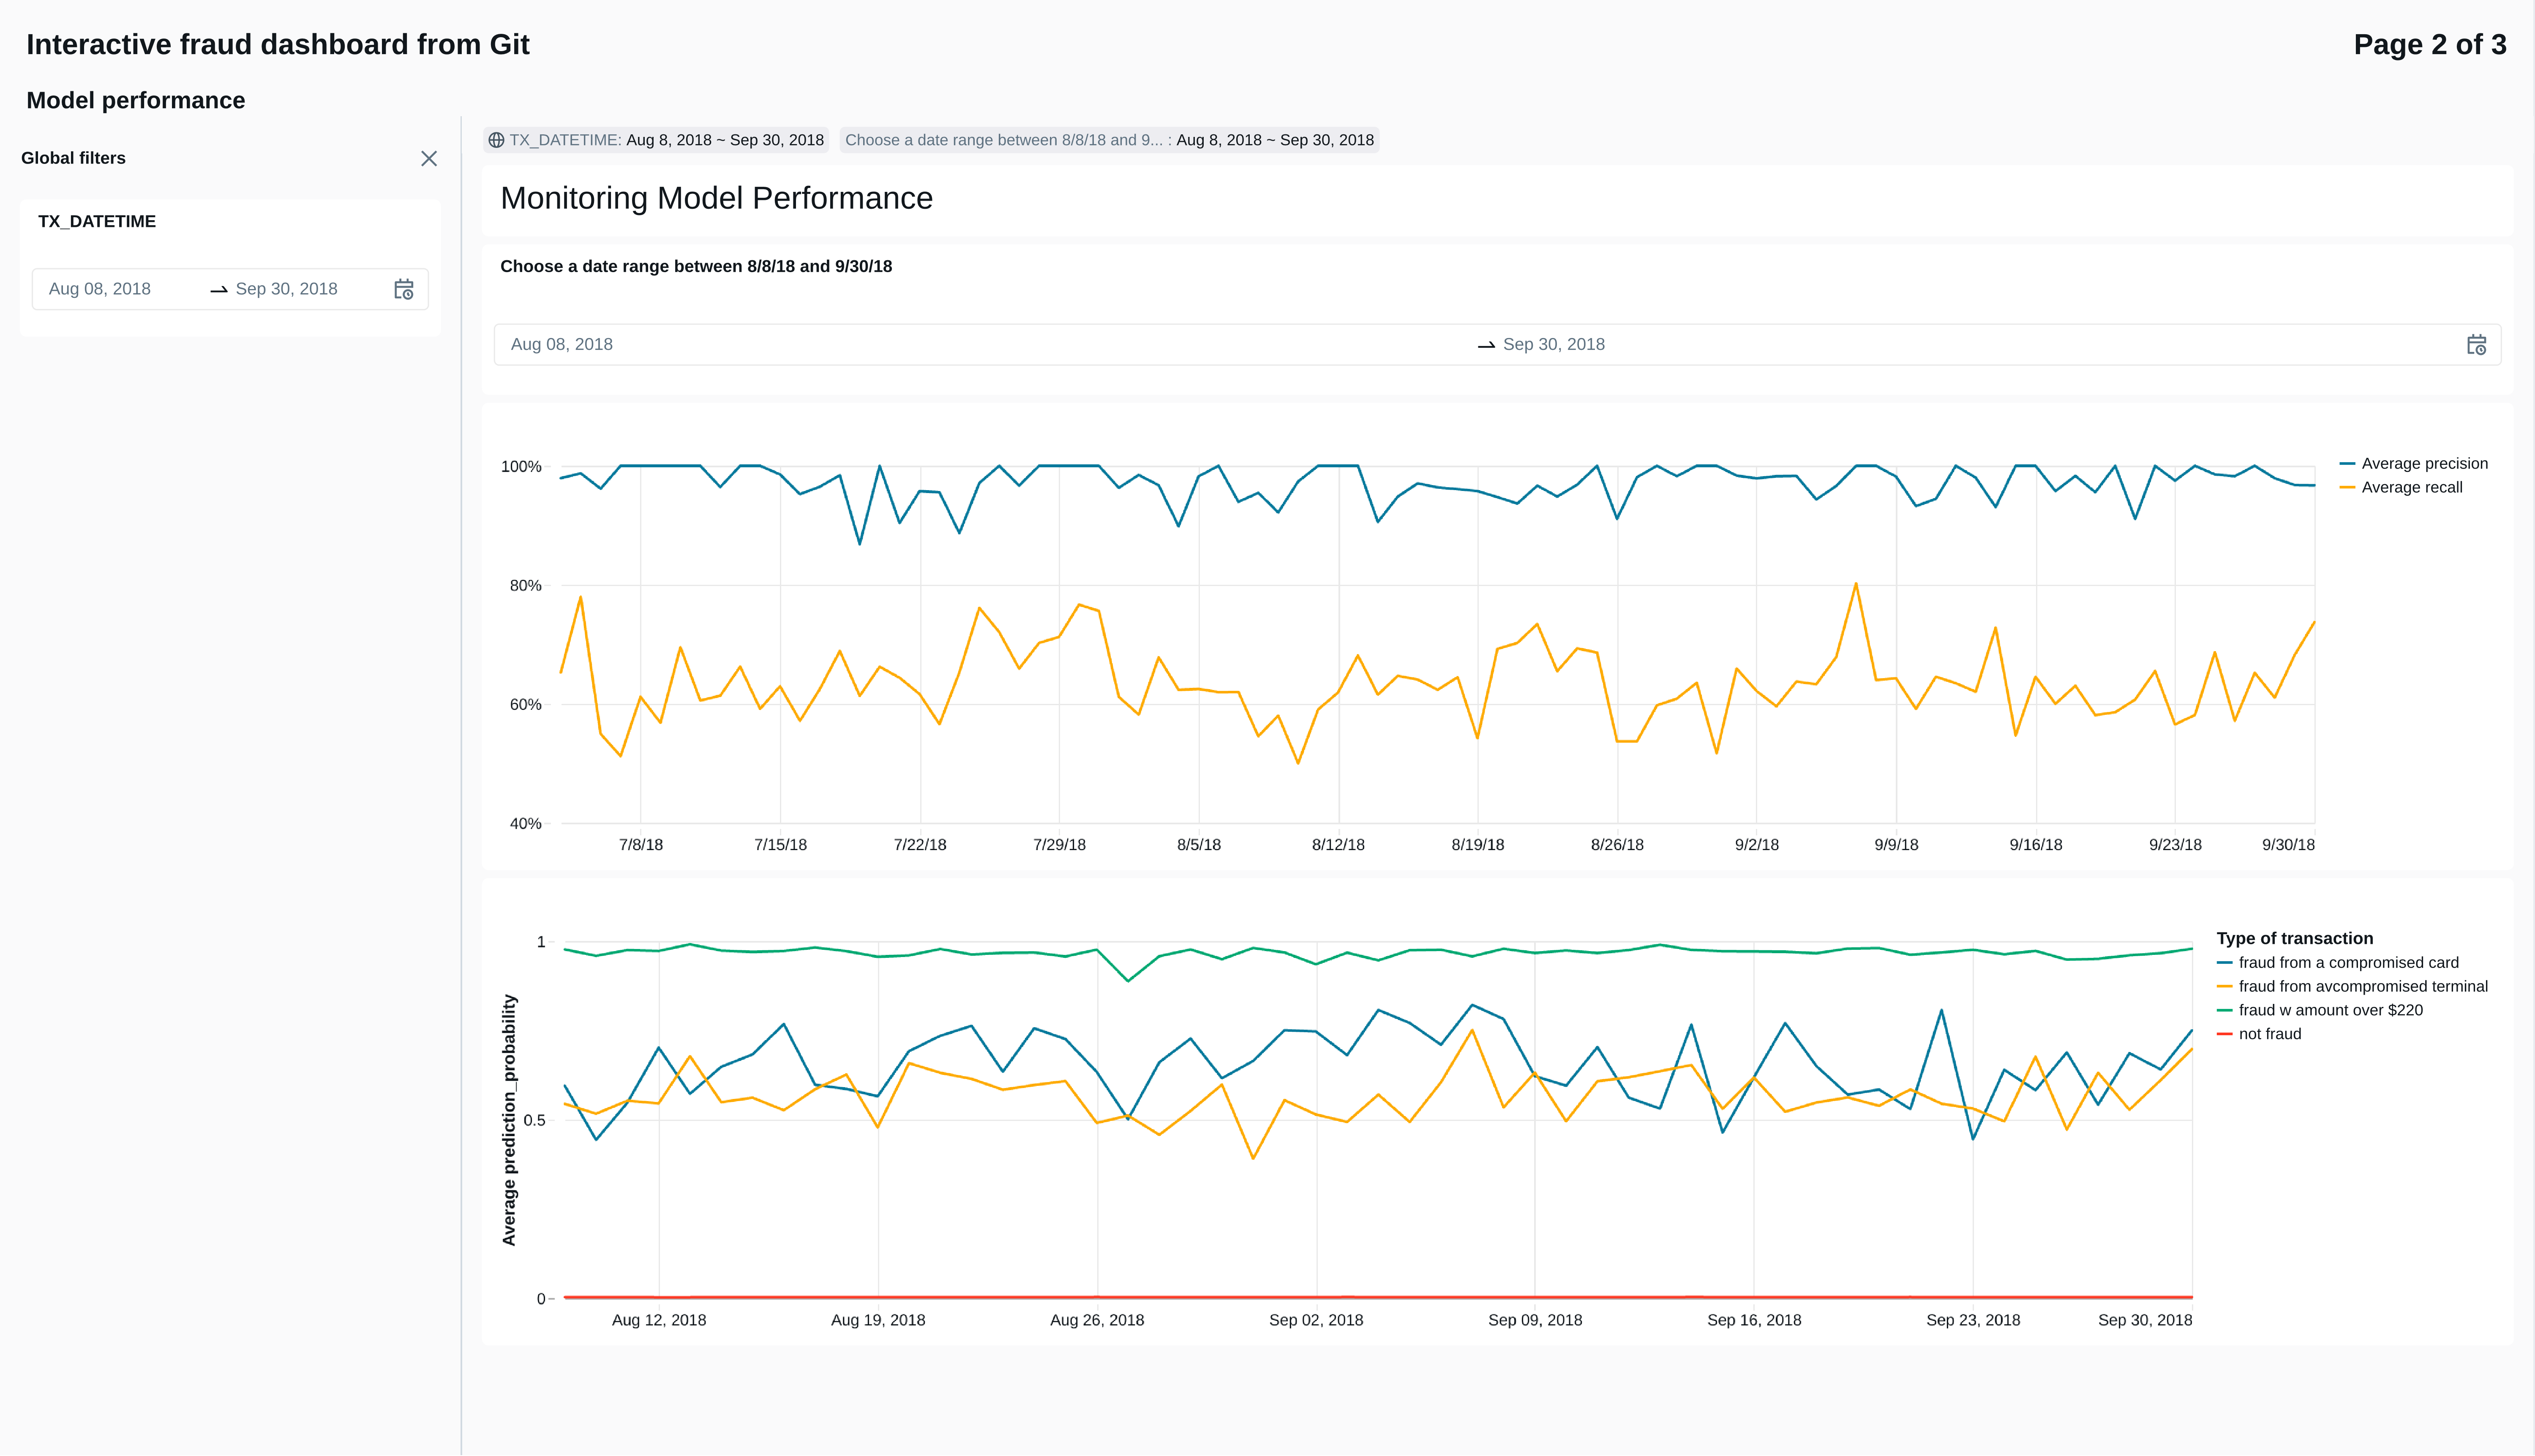
9.3 The dashboard page monitoring model performance
To monitor model performace, we generated two time series. The first tracks precision and recall over time. The second tracks the average predicted probability by fraud scenario, to see which types of fraud signals the model is picking up.
Click to expand/hide SQL code for daily model metrics
 ```sql
SELECT
  date_trunc('day', TX_DATETIME) AS date,
  COUNT(*) AS total_transactions,
  SUM(TX_FRAUD) AS total_frauds,
  AVG(prediction_probability) AS avg_prediction_score,
  SUM(CASE WHEN prediction = 1 THEN 1 ELSE 0 END) AS predicted_frauds,
  SUM(CASE WHEN prediction = 1 AND TX_FRAUD = 1 THEN 1 ELSE 0 END) AS true_positives,
  SUM(CASE WHEN prediction = 1 AND TX_FRAUD = 0 THEN 1 ELSE 0 END) AS false_positives,
  SUM(CASE WHEN prediction = 0 AND TX_FRAUD = 1 THEN 1 ELSE 0 END) AS false_negatives,
  -- Compute precision and recall safely
  CASE WHEN SUM(CASE WHEN prediction = 1 THEN 1 ELSE 0 END) > 0
    THEN SUM(CASE WHEN prediction = 1 AND TX_FRAUD = 1 THEN 1 ELSE 0 END)*1.0 / SUM(CASE WHEN prediction = 1 THEN 1 ELSE 0 END)
    ELSE NULL END AS precision,
  CASE WHEN SUM(TX_FRAUD) > 0
    THEN SUM(CASE WHEN prediction = 1 AND TX_FRAUD = 1 THEN 1 ELSE 0 END)*1.0 / SUM(TX_FRAUD)
    ELSE NULL END AS recall
FROM
  delta.`/Volumes/workspace/default/fraud_volume/db_predictions_delta_table`
GROUP BY date
ORDER BY date;
``` 
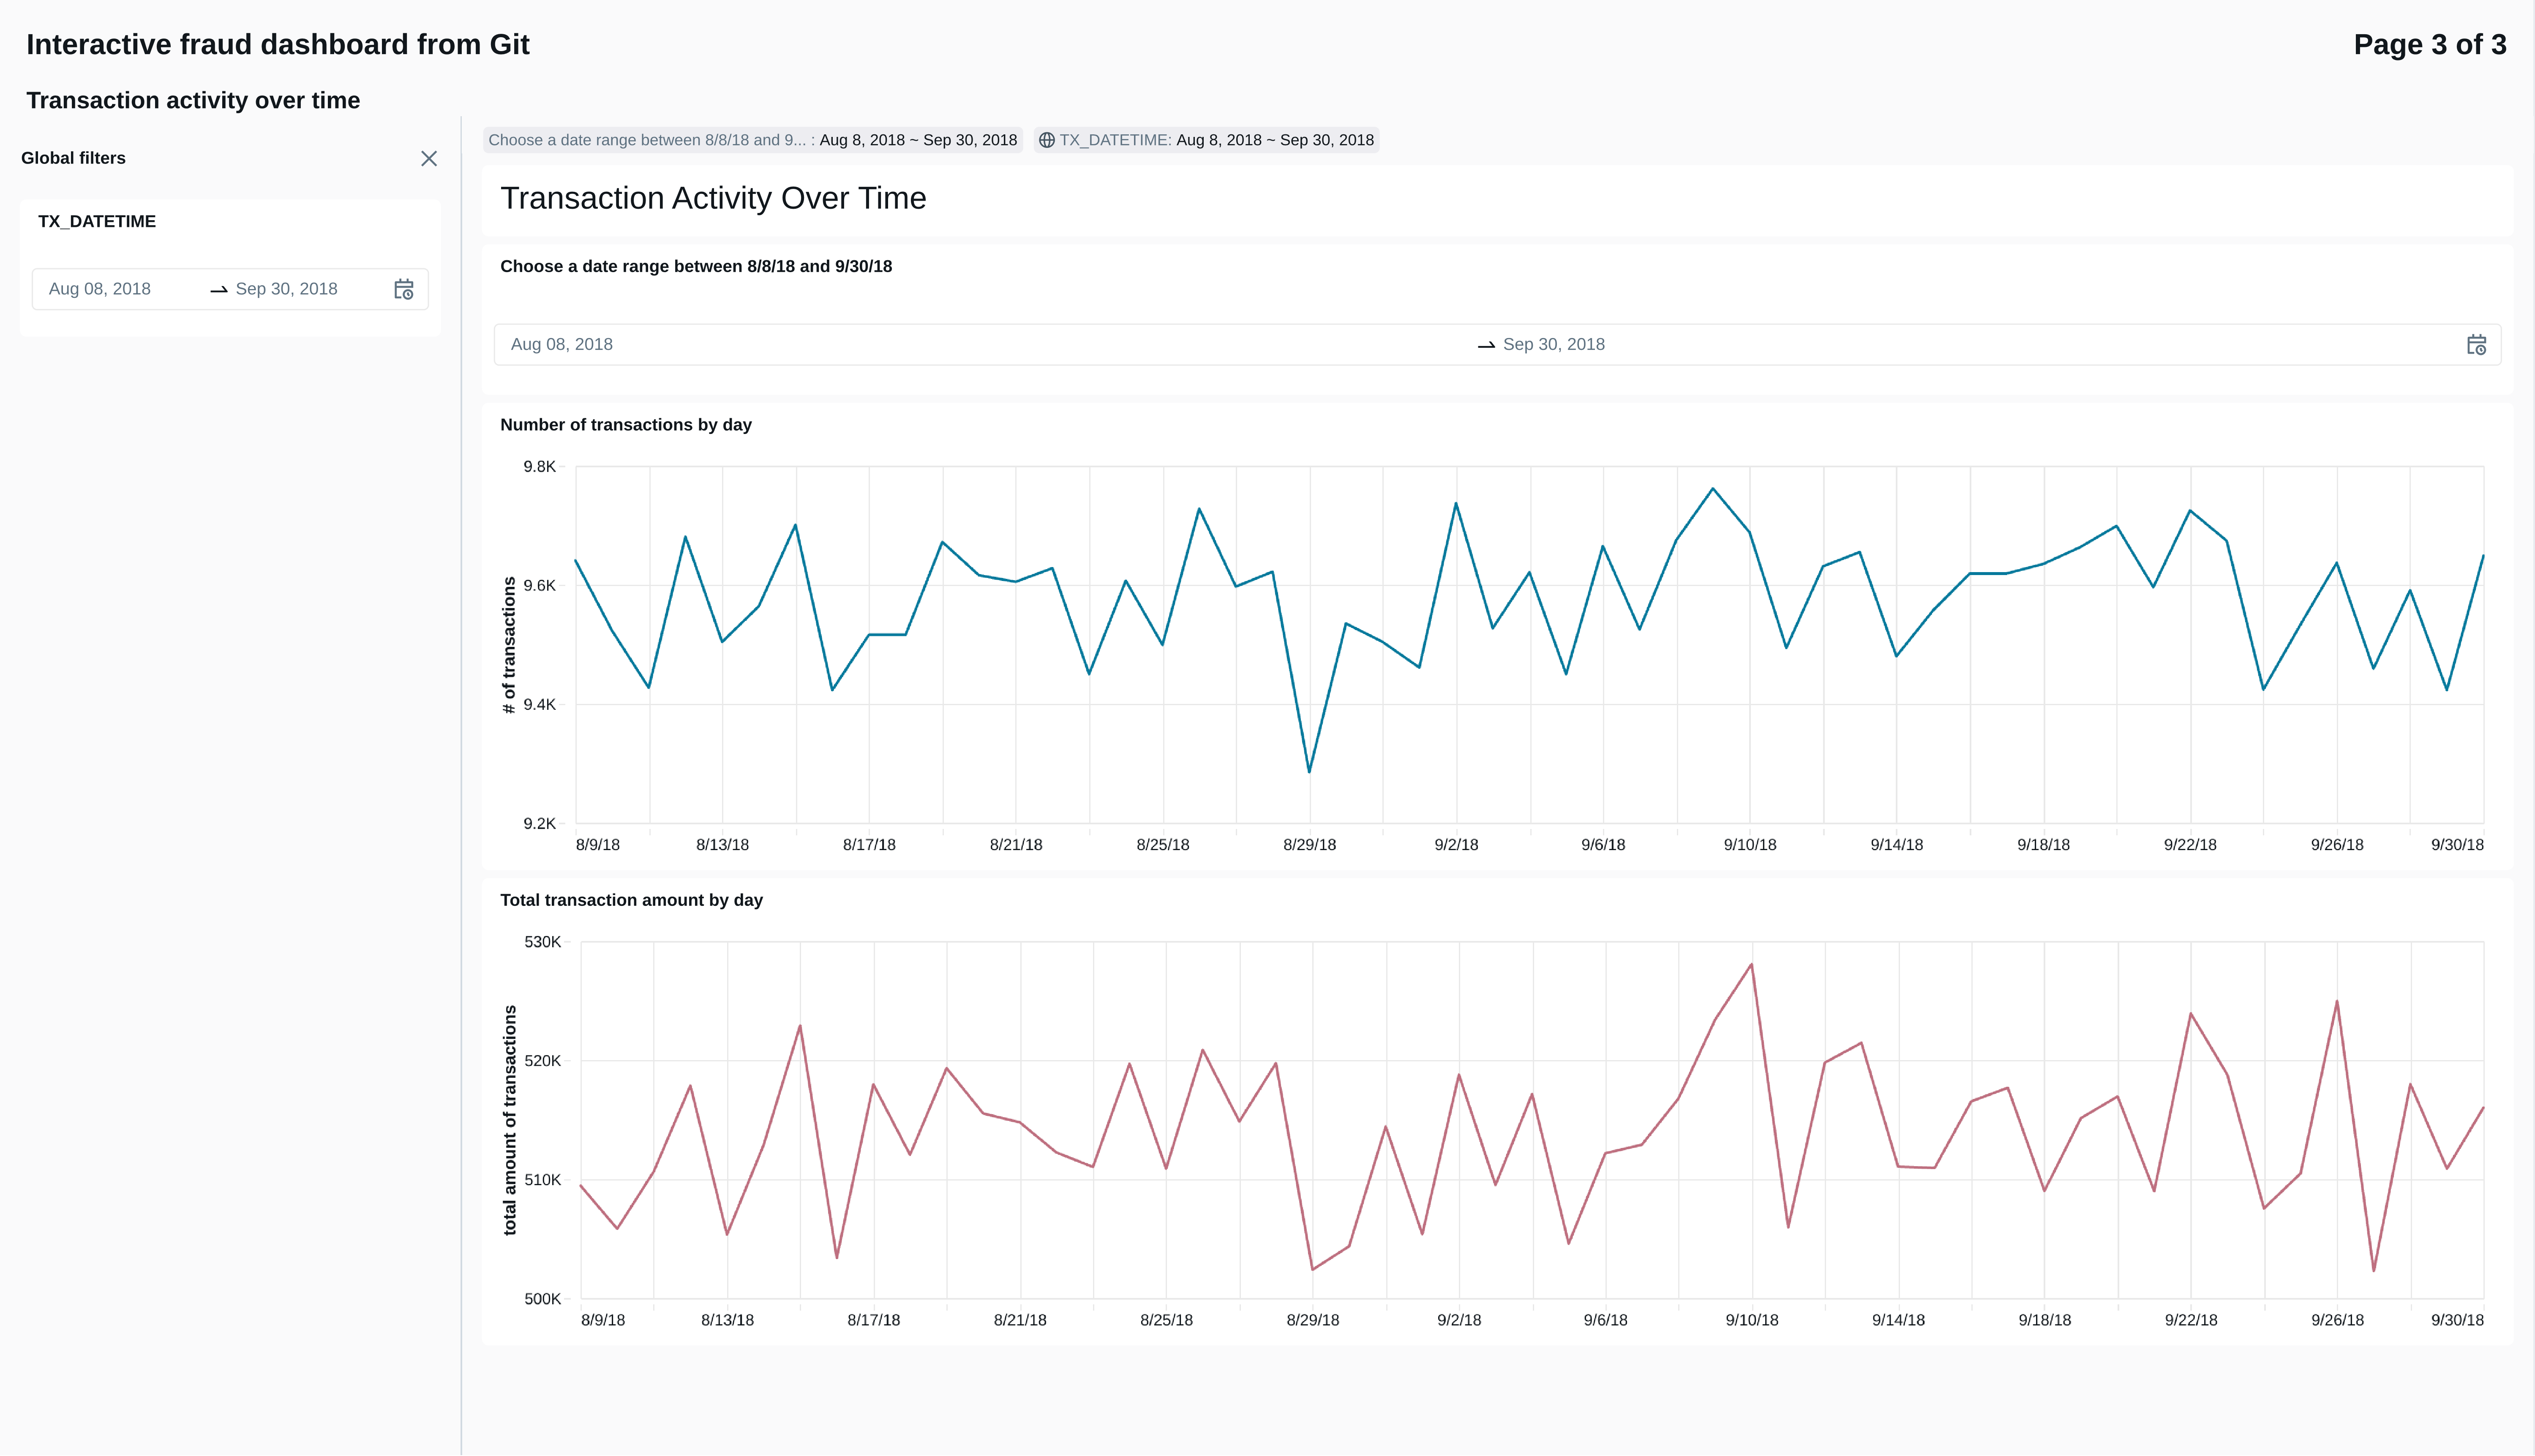
9.4 The dashboard page monitoring high-level tranasction activity
The final dashboard page simply tracks the numbers and amounts of transactions over time.